Impact Overview
We improve the livelihoods of Americans by strengthening communities and driving innovation through locally-driven economic development.
EDA's Impact
Impact that starts locally and spans nationally (Data for 2024)
583
Grants Awarded
$1.05 Billion
Amount Awarded
52,135
Jobs Created or Saved

EDA Impact by State Reports
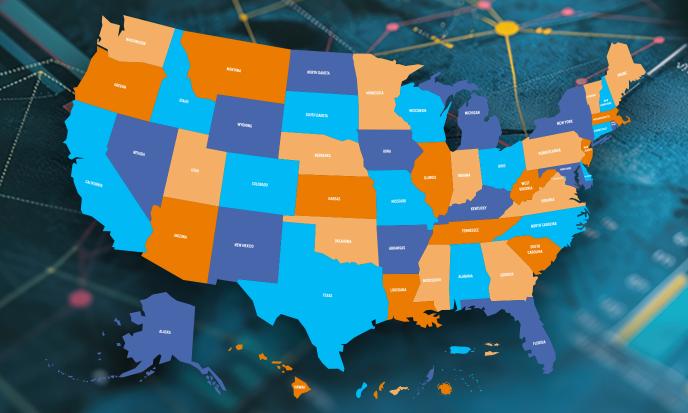
Explore how EDA is making a difference for Americans in every community in every state and territory. For questions or support with EDA economic data reporting, please contact EDAMedia@eda.gov.
Explore Our Impact

Historic Impact
The Urban Institute, a nonprofit research organization, received an EDA grant on October 1, 2018. This research, funded in FY2019 and running through FY2023, examined EDA’s funding allocations and grantmaking programs, the agency’s history and goals, the attributes of communities receiving EDA investments, and the extent to which EDA investments spur local economic growth.

Annual Reports
EDA’s Annual Reports are designed to be a web-based resource. An interactive map allows readers to quickly retrieve the FY 2020 summary and case studies of investments in any given state or territory. With just one click, communities can see the projects EDA has undertaken with local partners in their region and around the country.

Performance
EDA collects and reports on performance measures in compliance with Government Performance and Results Act of 1993 that, as amended by the GPRA Modernization Act of 2010, establishes requirements for all agencies to collect, analyze, and report on their performance. EDA’s performance goals and specific performance metrics are tied to the U.S. Department of Commerce’s performance management structure, and performance targets are tied to EDA’s annual budget request and appropriations.
